Trigonometry
Topic outline
-
Welcome to Trigonometry [CMAT 1223]!
Course Introduction
This Trigonometry [CMAT 1223] course adheres to the scope and sequence of a one-semester Trigonometry course. The course description provided is the from the statewide common course information.Course Description: Trigonometric functions and graphs; inverse trigonometric functions; fundamental identities and angle formulas; solving equations; triangles with applications; polar coordinate system.Upon successful completion of this course, the student will be able to:
- Apply the definitions of angles, triangles, and the rectangular coordinate system to the six trigonometric functions.
- Solve problems using right triangle trigonometry.
- Extending the six trig functions on each quadrant by defining a reference angle with + - signs.
- Solve problems for arc length and area of a sector.
- Calculate linear and angular speed to solve related problems.
- Graph trigonometric functions and their transformations.
- Solve problems involving the inverses of trigonometric functions.
- Verify trigonometric identities and solve problems involving sum, difference, double-angle, half-angle, sum-to-product, and product-to-sum formulas.
- Solve trigonometric equations.
- Solve triangles and applications using the Laws of Sines, the Law of Cosines and area formulas.
- Plot points and rewrite equations between the rectangular and polar coordinate systems.
- Apply the De Moivre’s and nth root Theorems
Adopting instructors can embed a welcome video or add additional text here.
Structure of the Course
The course includes 10 content Modules which covers each of the 10 chapters in the textbook (provided link). Each module includes a brief introduction text with module learning objectives, links to the corresponding Pressbook sections, Chapter Summary/Review, homework assignments in MyOpenMath, Section and Chapter Review Exercises from the Pressbook, a Quiz in MyOpenMath, and a Q&A discussion forum for that Module. There are additional modules for smaller Exams, a Midterm Exam, and/or Final Exam.
Navigating the Course
This course is set up in Modules covering various topics which may be accessed from the course navigation menu on the left or by scrolling below. Modules may be collapsed in the menu and it the body of the course to minimize scrolling. Many items are required and may be marked as completed automatically when the activity has been submitted (the broken check box), but others will marked as done by the student (the solid check box).
Please move through the items below and continue through the Learner Support and Getting Started modules before moving on to Module 1. Be sure to check for announcements and due dates to stay on track.Adopting instructors can embed a navigation video or add additional text here.
 This course and its contents, developed by author: Jared Eusea, and editors/reviewers: Bimal Kunwor, Donna Densmore, and Yi Zhen, are licensed under a Creative Commons Attribution 4.0 International License by LOUIS: The Louisiana Library Network, except where otherwise noted.
 Adopting instructors should edit the About Your Instructor and Office Hours Information pages in this Module.
-
Adopting instructors should edit all pages in this Module - as per their own Institution's policies.
-
This module contains all the items you should review and complete before you begin Module 1. Before moving on, be sure to:
- Check the News and Announcements Forum
- Read the Course Syllabus
- Introduce yourself to the class
- Read the instructions for the Q & A Forum
Good luck in the course!-
This forum contains general news and announcements. You can find all announcements listed in the "Latest News" block in Course Tools within this course or on your My Courses page.
-
Students mustMark as done
Use this forum to tell us a little about yourself and your interests. Some topic ideas:
- What is your field of study/research interest or concentration?
- What are you most interested in learning about in this class and why?
- Have you ever taken an online class before?
- Any other information you would like to share with your classmates, such as special interests or activities.
Post a picture! We look forward to meeting you.
-
Students mustMark as done
Use this forum to ask your instructor any questions you have about the course. You may post at any time, and your instructor will respond here. Be as specific as possible.
Please keep in mind that others can see your posts, so do not post any personal information. If you have questions about your grade, please email your instructor directly. You can expect a response to posts and emails within [X] hours. [Recommendation is 24 hours M-F, next business day on weekends.]
Subscription should be set to Auto.
- Check the News and Announcements Forum
-
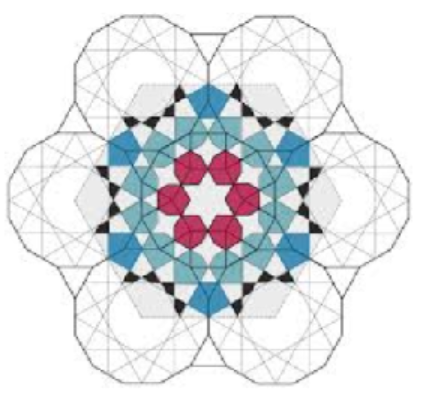
Circles and triangles are the simplest geometric figures. A circle is the simplest sort of curve, and a triangle is the simplest polygon -- the one with the fewest sides. Each has properties that makes it useful in many fields of endeavor. A triangle is the most stable of polygons, because once its sides are fixed in length, its angles cannot change. A triangular truss bridge is a stable structure. A three-legged stool will not wobble. A circle encloses more area then any other figure of the same length, or perimeter, and a sphere encloses more space.
A geodesic dome is a portion of a sphere constructed with triangles. It has been called "the strongest, lightest and most efficient means of enclosing space known to man.” Geodesic domes may also help us learn how to live on another planet.
In 2017, the United Arab Emirates began construction on Mars Science City, a series of interconnecting geodesic domes designed to be a realistic model for living on Mars. The city will cover 1.9 million square feet, and its walls will be 3D-printed using sand from the desert. The city will contain laboratories to address food, sustainability, and energy issues all over the world. Finally, the project will implement an experiment wherein a team will spend a year living in the simulated planet for a year.
Image Caption: Many geometric designs are made of circles and triangles.
(Content & Image Source: Chapter 1 Introduction, Trigonometry, Katherine Yoshiwara, GNU Free Documentation License)
Upon completion of this module, you will be able to:1.1 Angles and Triangles
- Sketch a triangle with given properties
- Find an unknown angle in a triangle
- Find angles formed by parallel lines and a transversal
- Find exterior angles of a triangle
- Find angles in isosceles, equilateral, and right triangles
- State reasons for conclusions
1.2 Similar Triangles
- Identify congruent triangles and find unknown parts
- Identify similar triangles
- Find unknown parts of similar triangles
- Solve problems using proportions and similar triangles
- Use proportions to relate sides of similar triangles
1.3 Circles-
Find the distance between two points
-
Distinguish between exact values and approximations
-
Graph a circle
-
Find and use the equation for a circle
-
Find the length of a fraction of a circle
-
Find the area of a sector of a circle
To achieve these objectives:
- Read the Module 1 Introduction (see above).
- Read Sections 1.1-1.3 of Chapter 1: Triangles and Circles in Trigonometry (links to each Section provided below)
- Note: The Algebra Refresher at the top of each Section might be beneficial before you begin
- At the end of each Section there is a list of Vocabulary, Concepts, Study Questions, and a Self-Check H5P activity
- Complete the MyOpenMath Homework Assignments for each Section (links provided below) - These are graded!
- View the Chapter 1 Summary and Review (link provided below)
- Practice the problems on the Exercises Sections, checking the solutions provided (links to each Section provided below)
- View the Exercises: Chapter 1 Review Problems (link provided below)
- Complete the MyOpenMath Quiz for Chapter 1 (link provided below) - This is graded!
- Once you complete the Quiz, upload your work in the Quiz Work Upload Assignment using the submission link below.
- Post in the Chapter 1 Q&A Discussion Forum - link provided below.
Note the check boxes to the right that help you track your progress: some are automatic, and some are manual.
Module Pressbooks Resources and Activities
You will find the following resources and activities in this module at the Pressbooks website. Click on the links below to access or complete each item.
- Sketch a triangle with given properties
-
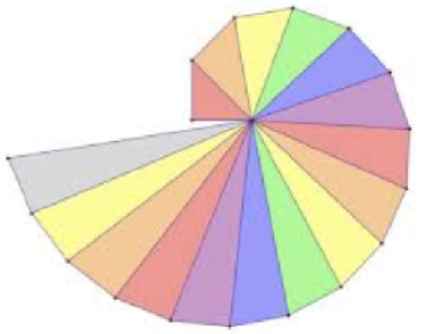 How would you measure the distance to an inaccessible object, such as a ship at sea? In the 6th century BC, the Greek philosopher Thales estimated the distances to ships at sea using triangulation, a method for calculating distances by forming triangles. Using trigonometry and the measured length of just one side, the lengths of the other sides can be calculated. Triangulation has been used to compute distances ever since. In the 16th century mapmakers began to use triangulation to position far-away places accurately. And as new methods in navigation and astronomy required greater precision, the idea of a survey using chains of triangles was developed.In 1802, the East India Company embarked on the Great Trigonometrical Survey of India. Its goal was to measure the entire Indian subcontinent with scientific precision. The surveyors began by measuring a baseline near Madras. The baseline was the only distance they measured; all other distances were calculated from it using measured angles. Each calculated distance became the base side of another triangle used to calculate the distance to another point, which in turn started another triangle. Eventually this process formed a chain of triangles connecting the origin point to other locations.Because of the size of the area to be surveyed, the surveyors did not triangulate the whole of India but instead created what they called a "gridiron" of triangulation chains running from North to South and East to West. You can see these chains in the map of the survey. The Survey was completed in 1871. Along the way it calculated the height of the Himalayan giants: Everest, K2, and Kanchenjunga, and provided one of the first accurate measurements of a section of an arc of longitude. Triangulation today is used for many purposes, including surveying, navigation, meteorology, astronomy, binocular vision, and location of earthquakes.Image Caption: The Pythagorean spiral is an image made with right triangles stacked by their hypotenuse and base.
(Content & Image Source: Chapter 2 Introduction, Trigonometry, Katherine Yoshiwara, GNU Free Documentation License)
Upon completion of this module, you will be able to:2.1 Side and Angle Relationships2.2 Right Triangle Trigonometry-
Identify inconsistencies in figures
-
Use the triangle inequality to put bounds on the lengths of sides
-
Use the Pythagorean theorem to find the sides of a right triangle
-
Use the Pythagorean theorem to identify right triangles
-
Solve problems using the Pythagorean theorem
2.3 Solving Right Triangles-
Use measurements to calculate the trigonometric ratios for acute angles
-
Use trigonometric ratios to find unknown sides of right triangles
-
Solve problems using trigonometric ratios
-
Use trig ratios to write equations relating the sides of a right triangle
-
Use relationships among the trigonometric ratios
To achieve these objectives:-
Solve a right triangle
-
Use inverse trig ratio notation
-
Use trig ratios to find an angle
-
Solve problems involving right triangles
-
Know the trig ratios for the special angles
- Read the Module 2 Introduction (see above).
- Read Sections 2.1-2.3 of Chapter 2: The Trigonometric Ratios in Trigonometry (links to each Section provided below)
- Note: The Algebra Refresher at the top of each Section might be beneficial before you begin
- At the end of each Section there is a list of Vocabulary, Concepts, Study Questions, and a Self-Check H5P activity
- Complete the MyOpenMath Homework Assignments for each Section (links provided below) - These are graded!
- View the Chapter 2 Summary and Review (link provided below)
- Practice the problems on the Exercises Sections, checking the solutions provided (links to each Section provided below)
- View the Exercises: Chapter 2 Review Problems (link provided below)
- Complete the MyOpenMath Quiz for Chapter 2 (link provided below) - This is graded!
- Once you complete the Quiz, upload your work in the Quiz Work Upload Assignment using the submission link below.
- Post in the Chapter 2 Q&A Discussion Forum - link provided below.
Note the check boxes to the right that help you track your progress: some are automatic, and some are manual.Module Pressbooks Resources and Activities
You will find the following resources and activities in this module at the Pressbooks website. Click on the links below to access or complete each item.
-
-
 The first science developed by humans is probably astronomy. Before the invention of clocks and calendars, early people looked to the night sky to help them keep track of time. What is the best time to plant crops, and when will they ripen? On what day exactly do important religious festivals fall? By tracking the motions of the stars, early astronomers could identify the summer and winter solstices and the equinoxes. The rising and setting of certain stars marked the hours of the night. If we think of the stars as traveling on a dome above the Earth, we create the celestial sphere. Actually, of course, the Earth itself rotates among the stars, but for calculating the motions of heavenly objects, this model works very well.Babylonian astronomers kept detailed records on the motion of the planets, and were able to predict solar and lunar eclipses. All of this required familiarity with angular distances measured on the celestial sphere. To find angles and distances on this imaginary sphere, astronomers invented techniques that are now part of spherical trigonometry. The laws of sines and cosines were first stated in this context, in a slightly different form than the laws for plane trigonometry.
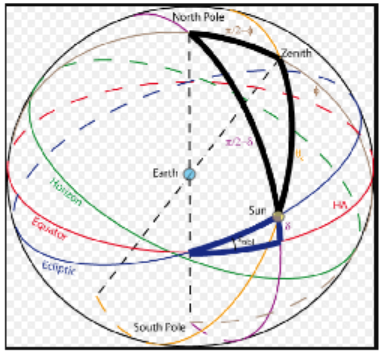
On a sphere, a great-circle lies in a plane passing through the sphere's center. It gives the shortest distance between any two points on a sphere, and is the analogue of a straight line on a plane. A spherical angle is formed where two such arcs intersect, and a spherical triangle is made up of three arcs of great circles. The spherical law of sines was first introduced in Europe in 1464 by Johann Muller, also known as Regiomontus, who wrote: "You, who wish to study great and wondrous things, who wonder about the movement of the stars, must read these theorems about triangles. ... For no one can bypass the science of triangles and reach a satisfying knowledge of the stars."Image Caption: Representation of the declination and of the hour angle in a geocentric system. On this figure, the equator and the ecliptic are fixed. The apparent motion of the Sun corresponds to a complete revolution along the ecliptic in one year. The hour angle (and the location of the local meridian (brown circle) trough the North pole and the zenith) change as the Earth makes a complete rotation around its axis in 1 day. (credit: Universite catholique de Louvain, http://www.climate.be/textbook/chapter2_node5_2.xml, CC BY-BC License)(Content & Image Source: Chapter 3 Introduction, Trigonometry, Katherine Yoshiwara, GNU Free Documentation License)
Upon completion of this module, you will be able to:3.1 Obtuse Angles-
Use the coordinate definition of the trig ratios
-
Find the trig ratios of supplementary angles
-
Know the trig ratios of the special angles in the second quadrant
-
Find two solutions of the equation \( sin( \theta)=k \)
-
Find the area of a triangle
3.2 The Law of Sines-
Use the Law of Sines to find a side
-
Use the Law of Sines to find an angle
-
Use the Law of Sines to solve an oblique triangle
-
Solve problems using the Law of Sines
-
Compute distances using parallax
-
Solve problems involving the ambiguous case
3.3 The Law of Cosines-
Use the Law of Cosines to find the side opposite an angle
-
Use the Law of Cosines to find an angle
-
Use the Law of Cosines to find a side adjacent to an angle
-
Decide which law to use
-
Solve a triangle
-
Solve problems using the Law of Cosines
To achieve these objectives:- Read the Module 3 Introduction (see above).
- Read Sections 3.1-3.3 of Chapter 3: Laws of Sines and Cosines in Trigonometry (links to each Section provided below)
- Note: The Algebra Refresher at the top of each Section might be beneficial before you begin
- At the end of each Section there is a list of Vocabulary, Concepts, Study Questions, and a Self-Check H5P activity
- Complete the MyOpenMath Homework Assignments for each Section (links provided below) - These are graded!
- View the Chapter 3 Summary and Review (link provided below)
- Practice the problems on the Exercises Sections, checking the solutions provided (links to each Section provided below)
- View the Exercises: Chapter 3 Review Problems (link provided below)
- Complete the MyOpenMath Quiz for Chapter 3 (link provided below) - This is graded!
- Once you complete the Quiz, upload your work in the Quiz Work Upload Assignment using the submission link below.
- Post in the Chapter 3 Q&A Discussion Forum - link provided below.
Note the check boxes to the right that help you track your progress: some are automatic, and some are manual.Module Pressbooks Resources and Activities
You will find the following resources and activities in this module at the Pressbooks website. Click on the links below to access or complete each item.
-
-
 In this module you will take your Exam 1 .
 Read the Exam 1 Information and Instructions page carefully and take note of any special submission guidelines.
Upon completion of this module, you will have:- Read and viewed the Exam 1 Information and Instructions page
- Scheduled your exam with the proctoring service [if applicable, delete if not needed]
- Post in the Exam 1 Q&A Discussion Forum - link provided below.
- Prepared for and submitted your Exam 1 [revise as needed]
- Uploaded your work in the Exam 1 Work Upload Assignment using the submission link below.
Attribution of image: ("Math, Numbers, Number image. Free for use." Pixabay.com. https://pixabay.com/photos/math-numbers-number-counting-5247958/)
Adopting instructors: Edit the Exam 1 Information and Instructions page.
-
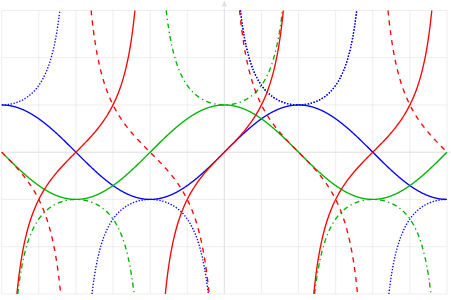
 A Lissajous figure is a pattern produced
by the intersection of two sinusoidal curves at right angles to each
other. They are the curves you often see on oscilloscope screens
depicting compound vibration. They were first studied by the American
mathematician Nathaniel Bowditch in 1815, and later by the French
mathematician Jules-Antoine Lissajous, and today have applications in
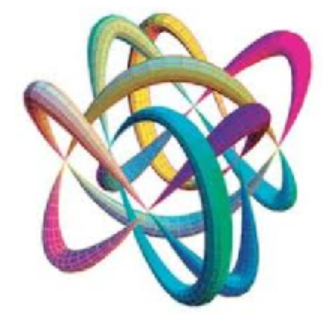
physics and astronomy, medicine, music, and many other fields.In 1855 Lissajous invented a pair of tuning forks designed to visualize sound vibrations. Each tuning fork had a small mirror mounted at the end of one prong, and a light beam reflected from one mirror to the other was projected onto a screen, producing a Lissajous figure. Stable patterns appear only when the two forks vibrate at frequencies in simple ratios, such as 2:1 or 3:2, which correspond to the musical intervals of the octave and perfect fifth.So, by observing the Lissajous figures, people were able to make tuning adjustments more accurately than they could do by ear. In 1942 the Dadaist artist Max Ernst punched a small hole in a can of paint, attached it to a coupled pendulum, and set it swinging to create Lissajous figures. He then used the designs in some of his paintings.In 2001, NASA launched the Wilkinson Microwave Anisotropy Probe (WMAP) to make fundamental measurements of our universe as a whole. The probe was positioned near a gravitational balance point between Earth and the Sun and moved in a controlled Lissajous pattern around the point. This orbit isolated the spacecraft from radio emissions from Earth. The goal of WMAP was to map the relative cosmic microwave background (CMB) temperature over the full sky. CMB radiation is the radiant heat left over from the Big Bang. Tiny fluctuations in the CMB are the result of fluctuations in the density of matter in the early universe, so they carry information about the initial conditions for the formation of cosmic structures such as galaxies, clusters, and voids.From the WMAP data, scientists were able to:
A Lissajous figure is a pattern produced
by the intersection of two sinusoidal curves at right angles to each
other. They are the curves you often see on oscilloscope screens
depicting compound vibration. They were first studied by the American
mathematician Nathaniel Bowditch in 1815, and later by the French
mathematician Jules-Antoine Lissajous, and today have applications in
physics and astronomy, medicine, music, and many other fields.In 1855 Lissajous invented a pair of tuning forks designed to visualize sound vibrations. Each tuning fork had a small mirror mounted at the end of one prong, and a light beam reflected from one mirror to the other was projected onto a screen, producing a Lissajous figure. Stable patterns appear only when the two forks vibrate at frequencies in simple ratios, such as 2:1 or 3:2, which correspond to the musical intervals of the octave and perfect fifth.So, by observing the Lissajous figures, people were able to make tuning adjustments more accurately than they could do by ear. In 1942 the Dadaist artist Max Ernst punched a small hole in a can of paint, attached it to a coupled pendulum, and set it swinging to create Lissajous figures. He then used the designs in some of his paintings.In 2001, NASA launched the Wilkinson Microwave Anisotropy Probe (WMAP) to make fundamental measurements of our universe as a whole. The probe was positioned near a gravitational balance point between Earth and the Sun and moved in a controlled Lissajous pattern around the point. This orbit isolated the spacecraft from radio emissions from Earth. The goal of WMAP was to map the relative cosmic microwave background (CMB) temperature over the full sky. CMB radiation is the radiant heat left over from the Big Bang. Tiny fluctuations in the CMB are the result of fluctuations in the density of matter in the early universe, so they carry information about the initial conditions for the formation of cosmic structures such as galaxies, clusters, and voids.From the WMAP data, scientists were able to:-
estimate the age of the universe at 13.77 billion years old.
-
calculate the curvature of space to within 0.4% of "flat" Euclidean.
-
determine that ordinary atoms (also called baryons) make up only 4.6% of the universe.
-
find that dark matter (matter not made of atoms) is 24.0% of the universe.
Image Caption: A Lissajous knot is a knot defined by parametric equations that take on specific forms of trigonometric functions with phase shifts (credit: https://en.wikipedia.org/wiki/Lissajous_knot)
(Content & Image Source: Chapter 4 Introduction, Trigonometry, Katherine Yoshiwara, GNU Free Documentation License)
Upon completion of this module, you will be able to:4.1 Angles and Rotation-
Use angles to represent rotations
-
Sketch angles in standard position
-
Find coterminal angles
-
Find and use reference angles
-
Find trigonometric ratios for the special angles
4.2 Graphs of Trigonometric Functions-
Find coordinates
-
Use bearings to determine position
-
Sketch graphs of the sine and cosine functions
-
Find the coordinates of points on a sine or cosine graph
-
Use function notation
-
Find reference angles
-
Solve equations graphically
-
Graph the tangent function
-
Find and use the angle of inclination of a line
4.3 Using Trigonometric Functions-
Solve trigonometric equations, graphically and algebraically
-
Find coordinates of points on circles
-
Use bearings to determine position
-
Find and use the angle of inclination of a line
-
Identify periodic functions and give their periods
-
Sketch periodic functions
-
Sketch graphs to model sinusoidal functions
-
Analyze periodic graphs
To achieve these objectives:- Read the Module 4 Introduction (see above).
- Read Sections 4.1-4.3 of Chapter 4: Trigonometric Functions in Trigonometry (links to each Section provided below)
- Note: The Algebra Refresher at the top of each Section might be beneficial before you begin
- At the end of each Section there is a list of Vocabulary, Concepts, Study Questions, and a Self-Check H5P activity
- Complete the MyOpenMath Homework Assignments for each Section (links provided below) - These are graded!
- View the Chapter 4 Summary and Review (link provided below)
- Practice the problems on the Exercises Sections, checking the solutions provided (links to each Section provided below)
- View the Exercises: Chapter 4 Review Problems (link provided below)
- Complete the MyOpenMath Quiz for Chapter 4 (link provided below) - This is graded!
- Once you complete the Quiz, upload your work in the Quiz Work Upload Assignment using the submission link below.
- Post in the Chapter 4 Q&A Discussion Forum - link provided below.
Note the check boxes to the right that help you track your progress: some are automatic, and some are manual.Module Pressbooks Resources and Activities
You will find the following resources and activities in this module at the Pressbooks website. Click on the links below to access or complete each item.
-
-
 When we think of tennis as a game of angles, we may imagine players racing up to the net, creating options to deliver powerful cross shots that will leave their opponent stumbling toward the line.
 This is an exciting and effective method of play, though it brings greater risk. But while the excitement of the game interplays with all types of geometry, some of the newest innovations make even more use of mathematics.
With balls traveling well over 100 miles per hour judges cannot always discern the centimeter or millimeters of difference between a ball that is in or out of bounds. Professional tennis was among the first sports to rely on an advanced tracking system called Hawk-Eye to help make close calls. The system uses several high-resolution cameras that are able to monitor and the ball's movement and its position on the court. Using the images from several cameras at once, the system's computers use trigonometric calculations to triangulate the ball's exact position and, essentially, turn a series of two-dimensional images into a three-dimensional one. Also, since the ball travels faster than the cameras' frame rate, the system also must make predictions to show where a ball is at all times. These technologies generally provide a more accurate game that builds more confidence and fairness. Similar technologies are used for baseball, and automated strike-calling is under discussion.
Image Caption: None.
(Content Source: Chapter 9 Introduction, Algebra and Trigonometry 2e, Jay Abramson, OpenStax, CC BY 4.0 License)
(Image Source: Chapter 5 Introduction, Trigonometry, Katherine Yoshiwara, GNU Free Documentation License)
Upon completion of this module, you will be able to:5.1 Algebra with Trigonometric Ratios-
Evaluate trigonometric expressions
-
Simplify trigonometric expressions
-
Recognize equivalent expressions
-
Multiply or expand trigonometric expressions
-
Factor trigonometric expressions
5.2 Solving Equations-
Use reference angles
-
Solve equations by trial and error
-
Use graphs to solve equations
-
Solve trigonometric equations for exact values
-
Use a calculator to solve trigonometric equations
-
Solve trigonometric equations that involve factoring
5.3 Trigonometric Identities-
Recognize identities
-
Verify identities
-
Rewrite expressions using identities
-
Use identities to evaluate expressions
-
Solve trigonometric equations
-
Given one trig ratio, find the others
To achieve these objectives:- Read the Module 5 Introduction (see above).
- Read Sections 5.1-5.3 of Chapter 5: Equations and Identities in Trigonometry (links to each Section provided below)
- Note: The Algebra Refresher at the top of each Section might be beneficial before you begin
- At the end of each Section there is a list of Vocabulary, Concepts, Study Questions, and a Self-Check H5P activity
- Complete the MyOpenMath Homework Assignments for each Section (links provided below) - These are graded!
- View the Chapter 5 Summary and Review (link provided below)
- Practice the problems on the Exercises Sections, checking the solutions provided (links to each Section provided below)
- View the Exercises: Chapter 5 Review Problems (link provided below)
- Complete the MyOpenMath Quiz for Chapter 5 (link provided below) - This is graded!
- Once you complete the Quiz, upload your work in the Quiz Work Upload Assignment using the submission link below.
- Post in the Chapter 5 Q&A Discussion Forum - link provided below.
Note the check boxes to the right that help you track your progress: some are automatic, and some are manual.
Module Pressbooks Resources and Activities
You will find the following resources and activities in this module at the Pressbooks website. Click on the links below to access or complete each item.
-
-
In this module you will take your Midterm Exam or Exam 2.
Read the Midterm Exam or Exam 2 Information and Instructions page carefully and take note of any special submission guidelines.
Upon completion of this module, you will have:- Read and viewed the Midterm Exam or Exam 2 Information and Instructions page
- Scheduled your exam with the proctoring service [if applicable, delete if not needed]
- Post in the Midterm Exam or Exam 2 Q&A Discussion Forum - link provided below.
- Prepared for and submitted your Midterm Exam or Exam 2 [revise as needed]
- Uploaded your work in the Midterm Exam or Exam 2 Work Upload Assignment using the submission link below.
Attribution of image: ("Math, Numbers, Number image. Free for use." Pixabay.com. https://pixabay.com/photos/math-numbers-number-counting-5247958/)Adopting instructors: Edit the Midterm Exam or Exam 2 Information and Instructions page.
-
 Have you ever wonderd why we divide the circle into 360 degrees? Nobody really knows the answer, but it may well have started around 600 BCE with the Babylonians. The Babylonians lived between the Tigris and Euphrates rivers in present day Turkey and Syria. They kept written records using a stylus to press cuneiform, or wedge-shaped, symbols into wet clay tablets, which were then baked in the sun. Thousands of these tablets have survived and give us detailed information about the mathematical practices of the time.The Babylonians used a base 60 number system because the number 60 has many factors. They did not invent decimal fractions, so they found it difficult to deal with remainders when doing division. But 60 can be divided evenly by 2, 3, 4, 5, and 6, which made calculations with common fractions much easier. We still see traces of their base 60 system in our own day: there are 60 seconds in a minute, and 60 minutes in an hour.In geometry, Babylonian mathematicians used the corner of an equilateral triangle as their basic unit of angular measure, and naturally divided that angle into 60 smaller angles. Now, if the corners of six equilateral triangles are placed together they form a complete circle, and that is why there are six times 60, or 360 degrees of arc in a circle. During the reign of Nebuchadnezzar, using the tools and technology available to them, Babylonian astronomers calculated that a complete year numbered 360 days. This made dividing the circle into 360 degrees even more useful. So the number 360 is not fundamental to the nature of a circle. If ancient civilizations had defined the full circle to be some other number of degrees, we'd probably be using that number today. But why do we need another, different way to measure angles? In this chapter we'll study radian measure, which at first may seem awkward and unnatural. As a hint, consider that although 360 is not fundamental to circles, the number
(Content & Image Source: Chapter 6 Introduction, Trigonometry, Katherine Yoshiwara, GNU Free Documentation License)
Upon completion of this module, you will be able to:6.1 Arclength and Radians-
Express angles in degrees and radians
-
Sketch angles given in radians
-
Estimate angles in radians
-
Use the arclength formula
-
Find coordinates of a point on a unit circle
-
Calculate angular velocity and area of a sector
6.2 The Circular Functions-
Know the trigonometric function values for the special angles in radians
-
Use a unit circle to find trig values
-
Find reference angles in radians
-
Evaluate trigonometric expressions
-
Find coordinates on a unit circle
-
Find an angle with a given terminal point on a unit circle
-
Use the tangent ratio to find slope
-
Find coordinates on a circle of radius
6.3 Graphs of the Circular Functions-
Graph the trig functions of real numbers
-
Solve trigonometric equations graphically
-
Work with reference angles
-
Solve trigonometric equations algebraically
-
Evaluate trigonometric functions of real numbers
-
Use trigonometric models
-
Locate points on the graphs of the trigonometric functions
-
Find the domain and range of a function
To achieve these objectives:- Read the Module 6 Introduction (see above).
- Read Sections 6.1-6.3 of Chapter 6: Radians in Trigonometry (links to each Section provided below)
- Note: The Algebra Refresher at the top of each Section might be beneficial before you begin
- At the end of each Section there is a list of Vocabulary, Concepts, Study Questions, and a Self-Check H5P activity
- Complete the MyOpenMath Homework Assignments for each Section (links provided below) - These are graded!
- View the Chapter 6 Summary and Review (link provided below)
- Practice the problems on the Exercises Sections, checking the solutions provided (links to each Section provided below)
- View the Exercises: Chapter 6 Review Problems (link provided below)
- Complete the MyOpenMath Quiz for Chapter 6 (link provided below) - This is graded!
- Once you complete the Quiz, upload your work in the Quiz Work Upload Assignment using the submission link below.
- Post in the Chapter 6 Q&A Discussion Forum - link provided below.
Note the check boxes to the right that help you track your progress: some are automatic, and some are manual.Module Pressbooks Resources and Activities
You will find the following resources and activities in this module at the Pressbooks website. Click on the links below to access or complete each item.
-
-
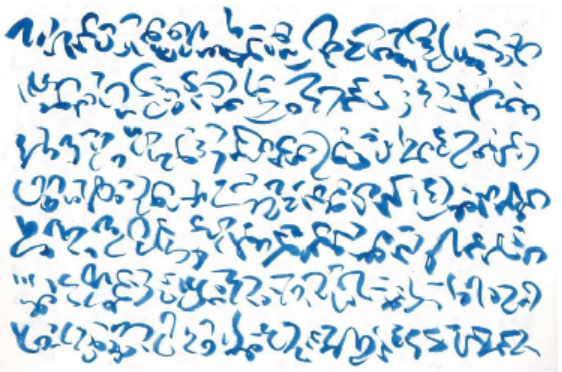
 Musical
instruments produce sound by the vibration of a string on a violin,
guitar, or piano, or a column of air in a brass or woodwind instrument.
The vibration causes a periodic variation in air pressure that is heard
as sound. Periodic vibrations create a pleasing, musical sound, while
random vibrations sound like noise. There are three distinguishing characteristics of musical notes: loudness, pitch, and timbre.
Musical
instruments produce sound by the vibration of a string on a violin,
guitar, or piano, or a column of air in a brass or woodwind instrument.
The vibration causes a periodic variation in air pressure that is heard
as sound. Periodic vibrations create a pleasing, musical sound, while
random vibrations sound like noise. There are three distinguishing characteristics of musical notes: loudness, pitch, and timbre.- The loudness of a note is measured by the magnitude, or amplitude, of the changes in air pressure.
- The timbre of the note allows us to tell a piano note from a guitar note with the same loudness and pitch.
- The pitch of the note is determined by its frequency, the number of times its basic pattern is repeated each second. For example, a note with pitch 440 hertz repeats its pattern 440 times per second. Humans can hear frequencies that range roughly from 20 to 18,000 hertz.
The simplest pressure vibration is produced by a tuning fork. The graph of its pressure function resembles a sine curve, and the corresponding sound is called a pure tone. When a musical instrument produces a pure tone, not only is its frequency produced, but integer multiples of the fundamental frequency, called harmonics, are produced as well. Sine curves of different frequencies combine to create the timbre of the note. If two musical instruments play the same note, the notes have the same pitch, but they sound different because the amplitudes of each of the harmonics is different for the two instruments.The French mathematician Joseph Fourier, who lived from 1768 to 1830, discovered that any periodic wave can be written as the sum of a number of sines and cosines with differing amplitudes. Fourier created a method for determining the frequencies and amplitudes of the simpler waves that make up a more complicated periodic function. Applying the Fourier transform to a sampled musical note reveals which component frequencies are present in the note. The same sound can then be re-synthesized by including those frequency components. Today, Fourier analysis is the foundation of signal processing, not only for audio waves, but for radio waves, light waves, seismic waves, and even images. By analyzing a compound waveform, the "noise" components can be isolated and removed in order to smooth out the signal. Fourier analysis is also used in X-ray crystallography to reconstruct a crystal structure from its diffraction pattern, and in nuclear magnetic resonance spectroscopy to determine the mass of ions from the frequency of their motion in a magnetic field.Image Caption: Fourier Art also allows you to create beautiful animations by smoothly changing the Fourier coefficients of a curve. This change can be uniform for all the coefficients or modeled by a specific function for each one of them, which offers a great potential for expression. (credit: https://www.fourierart.com/)(Content & Image Source: Chapter 7 Introduction, Trigonometry, Katherine Yoshiwara, GNU Free Documentation License)
Upon completion of this module, you will be able to:7.1 Transformations of Graphs-
Identify the amplitude, period, and midline of a circular function
-
Graph a circular function
-
Find a formula for the graph of a circular function
-
Model periodic phenomena with circular functions
-
Graph transformations of the tangent function
-
Solve trigonometric equations graphically
7.2 The General Sinusoidal Function- Graph trigonometric functions using a table of values
- Find a formula for a transformation of a trigonometric function
- Solve trigonometric equations graphically
- Model periodic phenomena with trigonometric functions
- Fit a circular function to data
7.3 Solving Equations- Find exact solutions to equations of the form \( sin(nx)=k \)
- Find all solutions between \( 0 \) and \( 2 \pi \)
- Use a substitution to solve trigonometric equations
- Write expressions for exact solutions
- Solve problems involving trigonometric models
To achieve these objectives:
- Read the Module 7 Introduction (see above).
- Read Sections 7.1-7.3 of Chapter 7: Circular Functions in Trigonometry (links to each Section provided below)
- Note: The Algebra Refresher at the top of each Section might be beneficial before you begin
- At the end of each Section there is a list of Vocabulary, Concepts, Study Questions, and a Self-Check H5P activity
- Complete the MyOpenMath Homework Assignments for each Section (links provided below) - These are graded!
- View the Chapter 7 Summary and Review (link provided below)
- Practice the problems on the Exercises Sections, checking the solutions provided (links to each Section provided below)
- View the Exercises: Chapter 7 Review Problems (link provided below)
- Complete the MyOpenMath Quiz for Chapter 7 (link provided below) - This is graded!
- Once you complete the Quiz, upload your work in the Quiz Work Upload Assignment using the submission link below.
- Post in the Chapter 7 Q&A Discussion Forum - link provided below.
Note the check boxes to the right that help you track your progress: some are automatic, and some are manual.
Module Pressbooks Resources and Activities
You will find the following resources and activities in this module at the Pressbooks website. Click on the links below to access or complete each item.
-
In this module you will take your Exam 2 or Exam 3. [revise as needed]
Read the Exam 2 or Exam 3 Information and Instructions page carefully and take note of any special submission guidelines.
Upon completion of this module, you will have:- Read and viewed the Exam 2 or Exam 3 Information and Instructions page
- Scheduled your exam with the proctoring service [if applicable, delete if not needed]
- Post in the Exam 2 or Exam 3 Q&A Discussion Forum - link provided below.
- Prepared for and submitted your Exam 2 or Exam 3 [revise as needed]
- Uploaded your work in the Exam 2 or Exam 3 Work Upload Assignment using the submission link below.
Attribution of image: ("Math, Numbers, Number image. Free for use." Pixabay.com. https://pixabay.com/photos/math-numbers-number-counting-5247958/)
Adopting instructors: Edit the Exam 2 or Exam 3 Information and Instructions page.
-
 Mapmakers have always faced an unavoidable challenge: It is impossible
to translate the surface of a sphere onto a flat map without some form
of distortion. Over the years, a variety of map projections have been
developed to suit different uses.The sixteenth century was an age of discovery, when explorers and merchants began sailing to distant and previously unknown lands. But at that time there was no reliable technology for navigation.Although more regions of the world were being mapped more accurately, a flat map by itself was not enough to help a sailor in the middle of the ocean. In 1569, the Flemish cartographer Gerardus Mercator published a new map using what is known as a cylindrical projection. To imagine how a Mercator projection works, picture shining a light through a glass globe onto a piece of paper rolled into a cylinder and wrapped around the globe. The cylinder is tangent to the globe at its equator. Notice how the latitude lines are farther apart the farther you get from the Equator. This projection distorts the size of objects as the latitude increases, so that Greenland and Antarctica appear much larger than they actually are.But the Mercator projection map is ideally suited for navigation, because any straight line on the map is a line of constant true bearing. If a navigator measures the bearing on the map from his location to his destination, he can set his ship's compass for the same bearing and maintain that course. However, the Mercator projection does not preserve distances. On a globe, circles of latitude (also known as parallels) get smaller as they move away from the Equator towards the poles. Thus, in the Mercator projection, when a globe is "unwrapped" on to a rectangular map, the parallels need to be stretched to the length of the Equator. Mercator had to increase the scale of his map gradually as it moved away from the equator, so that the latitude lines appear equal in length to the equator.The horizontal scale factor at any latitude must be inversely proportional to lengths on that latitude. Because the radius of the circle of latitude \( \theta \) is \( Rcos( \theta) \)
Mapmakers have always faced an unavoidable challenge: It is impossible
to translate the surface of a sphere onto a flat map without some form
of distortion. Over the years, a variety of map projections have been
developed to suit different uses.The sixteenth century was an age of discovery, when explorers and merchants began sailing to distant and previously unknown lands. But at that time there was no reliable technology for navigation.Although more regions of the world were being mapped more accurately, a flat map by itself was not enough to help a sailor in the middle of the ocean. In 1569, the Flemish cartographer Gerardus Mercator published a new map using what is known as a cylindrical projection. To imagine how a Mercator projection works, picture shining a light through a glass globe onto a piece of paper rolled into a cylinder and wrapped around the globe. The cylinder is tangent to the globe at its equator. Notice how the latitude lines are farther apart the farther you get from the Equator. This projection distorts the size of objects as the latitude increases, so that Greenland and Antarctica appear much larger than they actually are.But the Mercator projection map is ideally suited for navigation, because any straight line on the map is a line of constant true bearing. If a navigator measures the bearing on the map from his location to his destination, he can set his ship's compass for the same bearing and maintain that course. However, the Mercator projection does not preserve distances. On a globe, circles of latitude (also known as parallels) get smaller as they move away from the Equator towards the poles. Thus, in the Mercator projection, when a globe is "unwrapped" on to a rectangular map, the parallels need to be stretched to the length of the Equator. Mercator had to increase the scale of his map gradually as it moved away from the equator, so that the latitude lines appear equal in length to the equator.The horizontal scale factor at any latitude must be inversely proportional to lengths on that latitude. Because the radius of the circle of latitude \( \theta \) is \( Rcos( \theta) \)
Upon completion of this module, you will be able to:8.1 Sum and Difference Formulas-
Find trig values for the negative of an angle
-
Verify or disprove possible formulas
-
Find exact values for trigonometric functions
-
Simplify or expand expressions
-
Solve equations
-
Prove standard identities
8.2 Inverse Trigonometric Functions-
Decide whether a function has an inverse function
-
Evaluate the inverse trig functions
-
Model problems with inverse trig functions
-
Solve formulas
-
Simplify expressions involving the inverse trig functions
-
Graph the inverse trig functions
8.3 The Reciprocal FunctionsTo achieve these objectives:-
Evaluate the reciprocal trig functions for angles in degrees or radians
-
Find values or expressions for the six trig ratios
-
Evaluate the reciprocal trig functions in applications
-
Given one trig ratio, find the others
-
Evaluate expressions exactly
-
Graph the secant, cosecant, and cotangent functions
-
Identify graphs of the reciprocal trig functions
-
Solve equations in secant, cosecant, and cotangent
-
Use identities to simplify or evaluate expressions
- Read the Module 8 Introduction (see above).
- Read Sections 8.1-8.3 of Chapter 8: More Functions and Identities in Trigonometry (links to each Section provided below)
- Note: The Algebra Refresher at the top of each Section might be beneficial before you begin
- At the end of each Section there is a list of Vocabulary, Concepts, Study Questions, and a Self-Check H5P activity
- Complete the MyOpenMath Homework Assignments for each Section (links provided below) - These are graded!
- View the Chapter 8 Summary and Review (link provided below)
- Practice the problems on the Exercises Sections, checking the solutions provided (links to each Section provided below)
- View the Exercises: Chapter 8 Review Problems (link provided below)
- Complete the MyOpenMath Quiz for Chapter 8 (link provided below) - This is graded!
- Once you complete the Quiz, upload your work in the Quiz Work Upload Assignment using the submission link below.
- Post in the Chapter 8 Q&A Discussion Forum - link provided below.
Note the check boxes to the right that help you track your progress: some are automatic, and some are manual.
Module Pressbooks Resources and Activities
You will find the following resources and activities in this module at the Pressbooks website. Click on the links below to access or complete each item.
-
-
 A vector is a mathematical tool that
indicates both a direction and a size, or magnitude. Vectors are often
represented visually as arrows. Usually the magnitude of the vector, (the
wind speed in this example), is shown by the length of the arrow, but
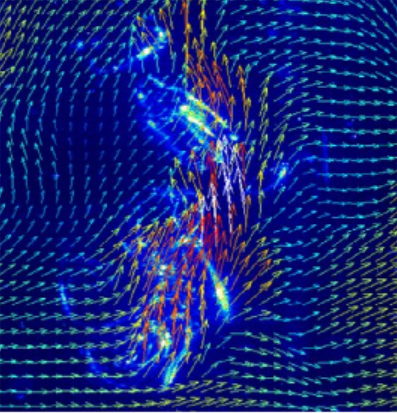
sometimes a color key makes the map easier to read.Of particular interest are the winds produced by tropical storms, or hurricanes and the forces that create the storm. Near the Earth's surface, winds spiral towards the center of a hurricane. They rotate in a counterclockwise direction in the Northern Hemisphere and in a clockwise direction in the Southern Hemisphere. These rotating winds are called the hurricane's primary circulation.A hurricane's primary circulation involves four main forces:
A vector is a mathematical tool that
indicates both a direction and a size, or magnitude. Vectors are often
represented visually as arrows. Usually the magnitude of the vector, (the
wind speed in this example), is shown by the length of the arrow, but
sometimes a color key makes the map easier to read.Of particular interest are the winds produced by tropical storms, or hurricanes and the forces that create the storm. Near the Earth's surface, winds spiral towards the center of a hurricane. They rotate in a counterclockwise direction in the Northern Hemisphere and in a clockwise direction in the Southern Hemisphere. These rotating winds are called the hurricane's primary circulation.A hurricane's primary circulation involves four main forces:-
the pressure gradient force,
-
the Coriolis force,
-
the centrifugal force, and
-
friction.
The center, or eye, of a hurricane contains the lowest atmospheric pressure, so the pressure gradient pulls air towards the center of the hurricane. In the Northern Hemisphere, this air is deflected towards the right because of the Coriolis force, a result of the Earth's own rotation. As the air turns to the right, the primary circulation around a hurricane begins to develop. Hurricane researchers know that strong vertical wind shear is a major factor affecting potential hurricane development. Wind shear is the variation of the wind's speed or direction over a short distance within the atmosphere. If there is too much wind, a storm has trouble developing into a cyclone. With little or no wind shear, the turning within the tropical system becomes vertically aligned, helping to keep it intact. Thus, the most favorable condition for tropical cyclone development is the absence of wind shear.Using simple mathematical models, researchers can estimate the degree to which the center of the storm becomes vertically tilted, based on the cloudiness within the eyewall and the structure of the wind outside the eyewall. By modeling the development of storm tilt, a better understanding of a tropical cyclone's behavior is gained in the presence and absence of wind shear. In particular, an El Niño weather system creates changes in the jet stream over the Northern Hemisphere, resultingin decreased wind shear in the Pacific and increased wind shear across much of the Atlantic basin, which suppresses hurricane activity. These model simulations show promise in understanding the processes driving the intensity of tropical cyclones.Image Caption: We can use vectors to indicate the speed and direction of the wind.
(Content & Image Source: Chapter 9 Introduction, Trigonometry, Katherine Yoshiwara, GNU Free Documentation License)
Upon completion of this module, you will be able to:9.1 Geometric Form-
Sketch a vector
-
Identify equal vectors
-
Sketch a scalar multiple of a vector
-
Sketch the sum of two vectors
-
Calculate a resultant vector
-
Use vectors to solve problems
-
Find components of a vector
-
Find the magnitude and direction of a vector given in components
-
Subtract vectors
9.2 Coordinate Form-
Convert the coordinate form of a vector to geometric form
-
Convert the geometric form of a vector to coordinate form
-
Compute sums and scalar multiples of vectors
-
Find a vector in a given direction with a given length
-
Solve problems with vectors
9.3 The Dot ProductTo achieve these objectives:- Find the component of \( w \) in the direction of \( v \)
-
Compute the dot product
-
Find the angle between two vectors
-
Resolve a vector into components in given directions
- Read the Module 9 Introduction (see above).
- Read Sections 9.1-9.3 of Chapter 9: Vectors in Trigonometry (links to each Section provided below)
- Note: The Algebra Refresher at the top of each Section might be beneficial before you begin
- At the end of each Section there is a list of Vocabulary, Concepts, Study Questions, and a Self-Check H5P activity
- Complete the MyOpenMath Homework Assignments for each Section (links provided below) - These are graded!
- View the Chapter 9 Summary and Review (link provided below)
- Practice the problems on the Exercises Sections, checking the solutions provided (links to each Section provided below)
- View the Exercises: Chapter 9 Review Problems (link provided below)
- Complete the MyOpenMath Quiz for Chapter 9 (link provided below) - This is graded!
- Once you complete the Quiz, upload your work in the Quiz Work Upload Assignment using the submission link below.
- Post in the Chapter 9 Q&A Discussion Forum - link provided below.
Note the check boxes to the right that help you track your progress: some are automatic, and some are manual.
Module Pressbooks Resources and Activities
You will find the following resources and activities in this module at the Pressbooks website. Click on the links below to access or complete each item.
-
-
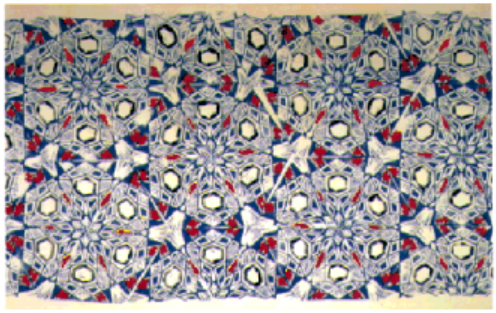
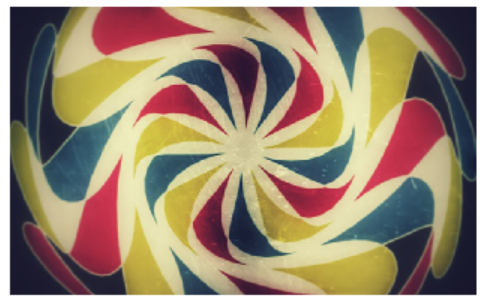
 The Barnsley fern is an example of a fractal. A fractal is an infinitely complex pattern created by iteration: repeating a process over and over in an ongoing feedback loop. One of the most famous and intriguing fractals is the Mandelbrot set, named after the French mathematician Benoît Mandelbrot, who lived from 1924 to 2010. The Mandelbrot set looks like a cardioid, or heart-shaped figure, studded with circles all around its boundary.Like the Barnsley fern, we can create the Mandelbrot set by repeatedly evaluating a simple equation over and over. This equation uses complex numbers. The plane of complex numbers is similar to a two dimensional coordinate system.Every point on the plane is represented by a complex number \( c=x+iy \), and we perform the following steps for every point:
- Starting with \( z_i=0 \), we create an infinite sequence of complex numbers \( z_n \) according to the rule \( z_{n+1}=(z_n)^2+c \)
- If this sequence increases to infinity (it diverges), we color the point \( c \) white. If the sequence does not increase beyond a certain limit (it is bounded), we color the point black.
- We create a sequence for every point \( c \) in the plane. The collection of all the black points is the Mandelbrot set. It sits in the portion of the plane where \( x \) is between \( -1 \) and \( 2 \)
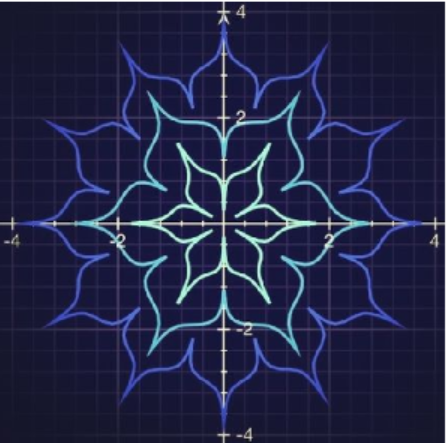
Because the calculations must be performed thousands or millions of times, we need computers to study them. The higher the number of iterations, the better the quality of the image produced. Not coincidentally, the Mandelbrot set was discovered in 1980, shortly after the invention of the personal computer. One of the intriguing features of fractal images is self-similarity. If we zoom in on a fractal, we see the same pattern repeated again and again, sometimes with interesting variations. You can see the copy of whole set embedded in the image. Fractal patterns seem familiar because the laws that govern the creation of fractals are found throughout the natural world. Tree branches, rivers, ice crystals, and seashells all form in fractal shapes.Image Caption: Trigonometric functions as parametric equations can draw beautiful symmetric polar graphs like the one shown.(Content & Image Source: Chapter 10 Introduction, Trigonometry, Katherine Yoshiwara, GNU Free Documentation License)
Upon completion of this module, you will be able to:10.1 Polar Coordinates-
Plot points in polar coordinates
-
Write polar coordinates for points
-
Convert Cartesian coordinates to polar
-
Convert Polar coordinates to Cartesian
-
Write alternate versions of polar coordinates
-
Sketch a region described by polar inequalities
-
Write polar inequalities to describe a region
-
Convert an equation to Cartesian coordinates
-
Convert an equation to polar coordinates
10.2 Polar Graphs-
Describe the effect of parameters in polar curves
-
Compare polar and Cartesian graphs
-
Sketch standard polar graphs
-
Identify standard polar graphs
-
Write equations for standard polar graphs
-
Find intersection points of polar graphs
10.3 Complex Numbers-
Write and simplify complex numbers
-
Perform arithmetic operations on complex numbers
-
Evaluate polynomials at complex numbers, expand polynomials
-
Graph complex numbers
-
Find a polynomial with given zeros
10.4 Polar Form for Complex NumbersTo achieve these objectives:-
Convert from polar form to standard form
-
Write a complex number in polar form
-
Find the product or quotient of two complex numbers in polar form
-
Find a power of a complex number
-
Find the complex roots of a number
- Read the Module 10 Introduction (see above).
- Read Sections 10.1-10.4 of Chapter 10: Polar Form for Complex Numbers in Trigonometry (links to each Section provided below)
- Note: The Algebra Refresher at the top of each Section might be beneficial before you begin
- At the end of each Section there is a list of Vocabulary, Concepts, Study Questions, and a Self-Check H5P activity
- Complete the MyOpenMath Homework Assignments for each Section (links provided below) - These are graded!
- View the Chapter 10 Summary and Review (link provided below)
- Practice the problems on the Exercises Sections, checking the solutions provided (links to each Section provided below)
- View the Exercises: Chapter 10 Review Problems (link provided below)
- Complete the MyOpenMath Quiz for Chapter 10 (link provided below) - This is graded!
- Once you complete the Quiz, upload your work in the Quiz Work Upload Assignment using the submission link below.
- Post in the Chapter 10 Q&A Discussion Forum - link provided below.
Note the check boxes to the right that help you track your progress: some are automatic, and some are manual.
Module Pressbooks Resources and Activities
You will find the following resources and activities in this module at the Pressbooks website. Click on the links below to access or complete each item.
- Starting with \( z_i=0 \), we create an infinite sequence of complex numbers \( z_n \) according to the rule \( z_{n+1}=(z_n)^2+c \)
-
In this module you will take your Final Exam.
Read the Final Exam Information and Instructions page carefully and take note of any special submission guidelines.
Upon completion of this module, you will have:- Read and viewed the Final Exam Information and Instructions page
- Scheduled your exam with the proctoring service [if applicable, delete if not needed]
- Post in the Final Exam Q&A Discussion Forum - link provided below.
- Prepared for and submitted your Final Exam [revise as needed]
- Uploaded your work in the Final Exam Work Upload Assignment using the submission link below.
Attribution of image: ("Math, Numbers, Number image. Free for use." Pixabay.com. https://pixabay.com/photos/math-numbers-number-counting-5247958/)
Adopting instructors: Edit the Final Exam Information and Instructions page.